Tybee Island, GA
Groundwater Wells

Well Locations
Locations of the six groundwater monitoring wells (Wells 1, 2, 3, 4, 7, and 8) used to measure groundwater level fluctuations across the study site.

Well 1
Example of installed groundwater monitoring well at the site.
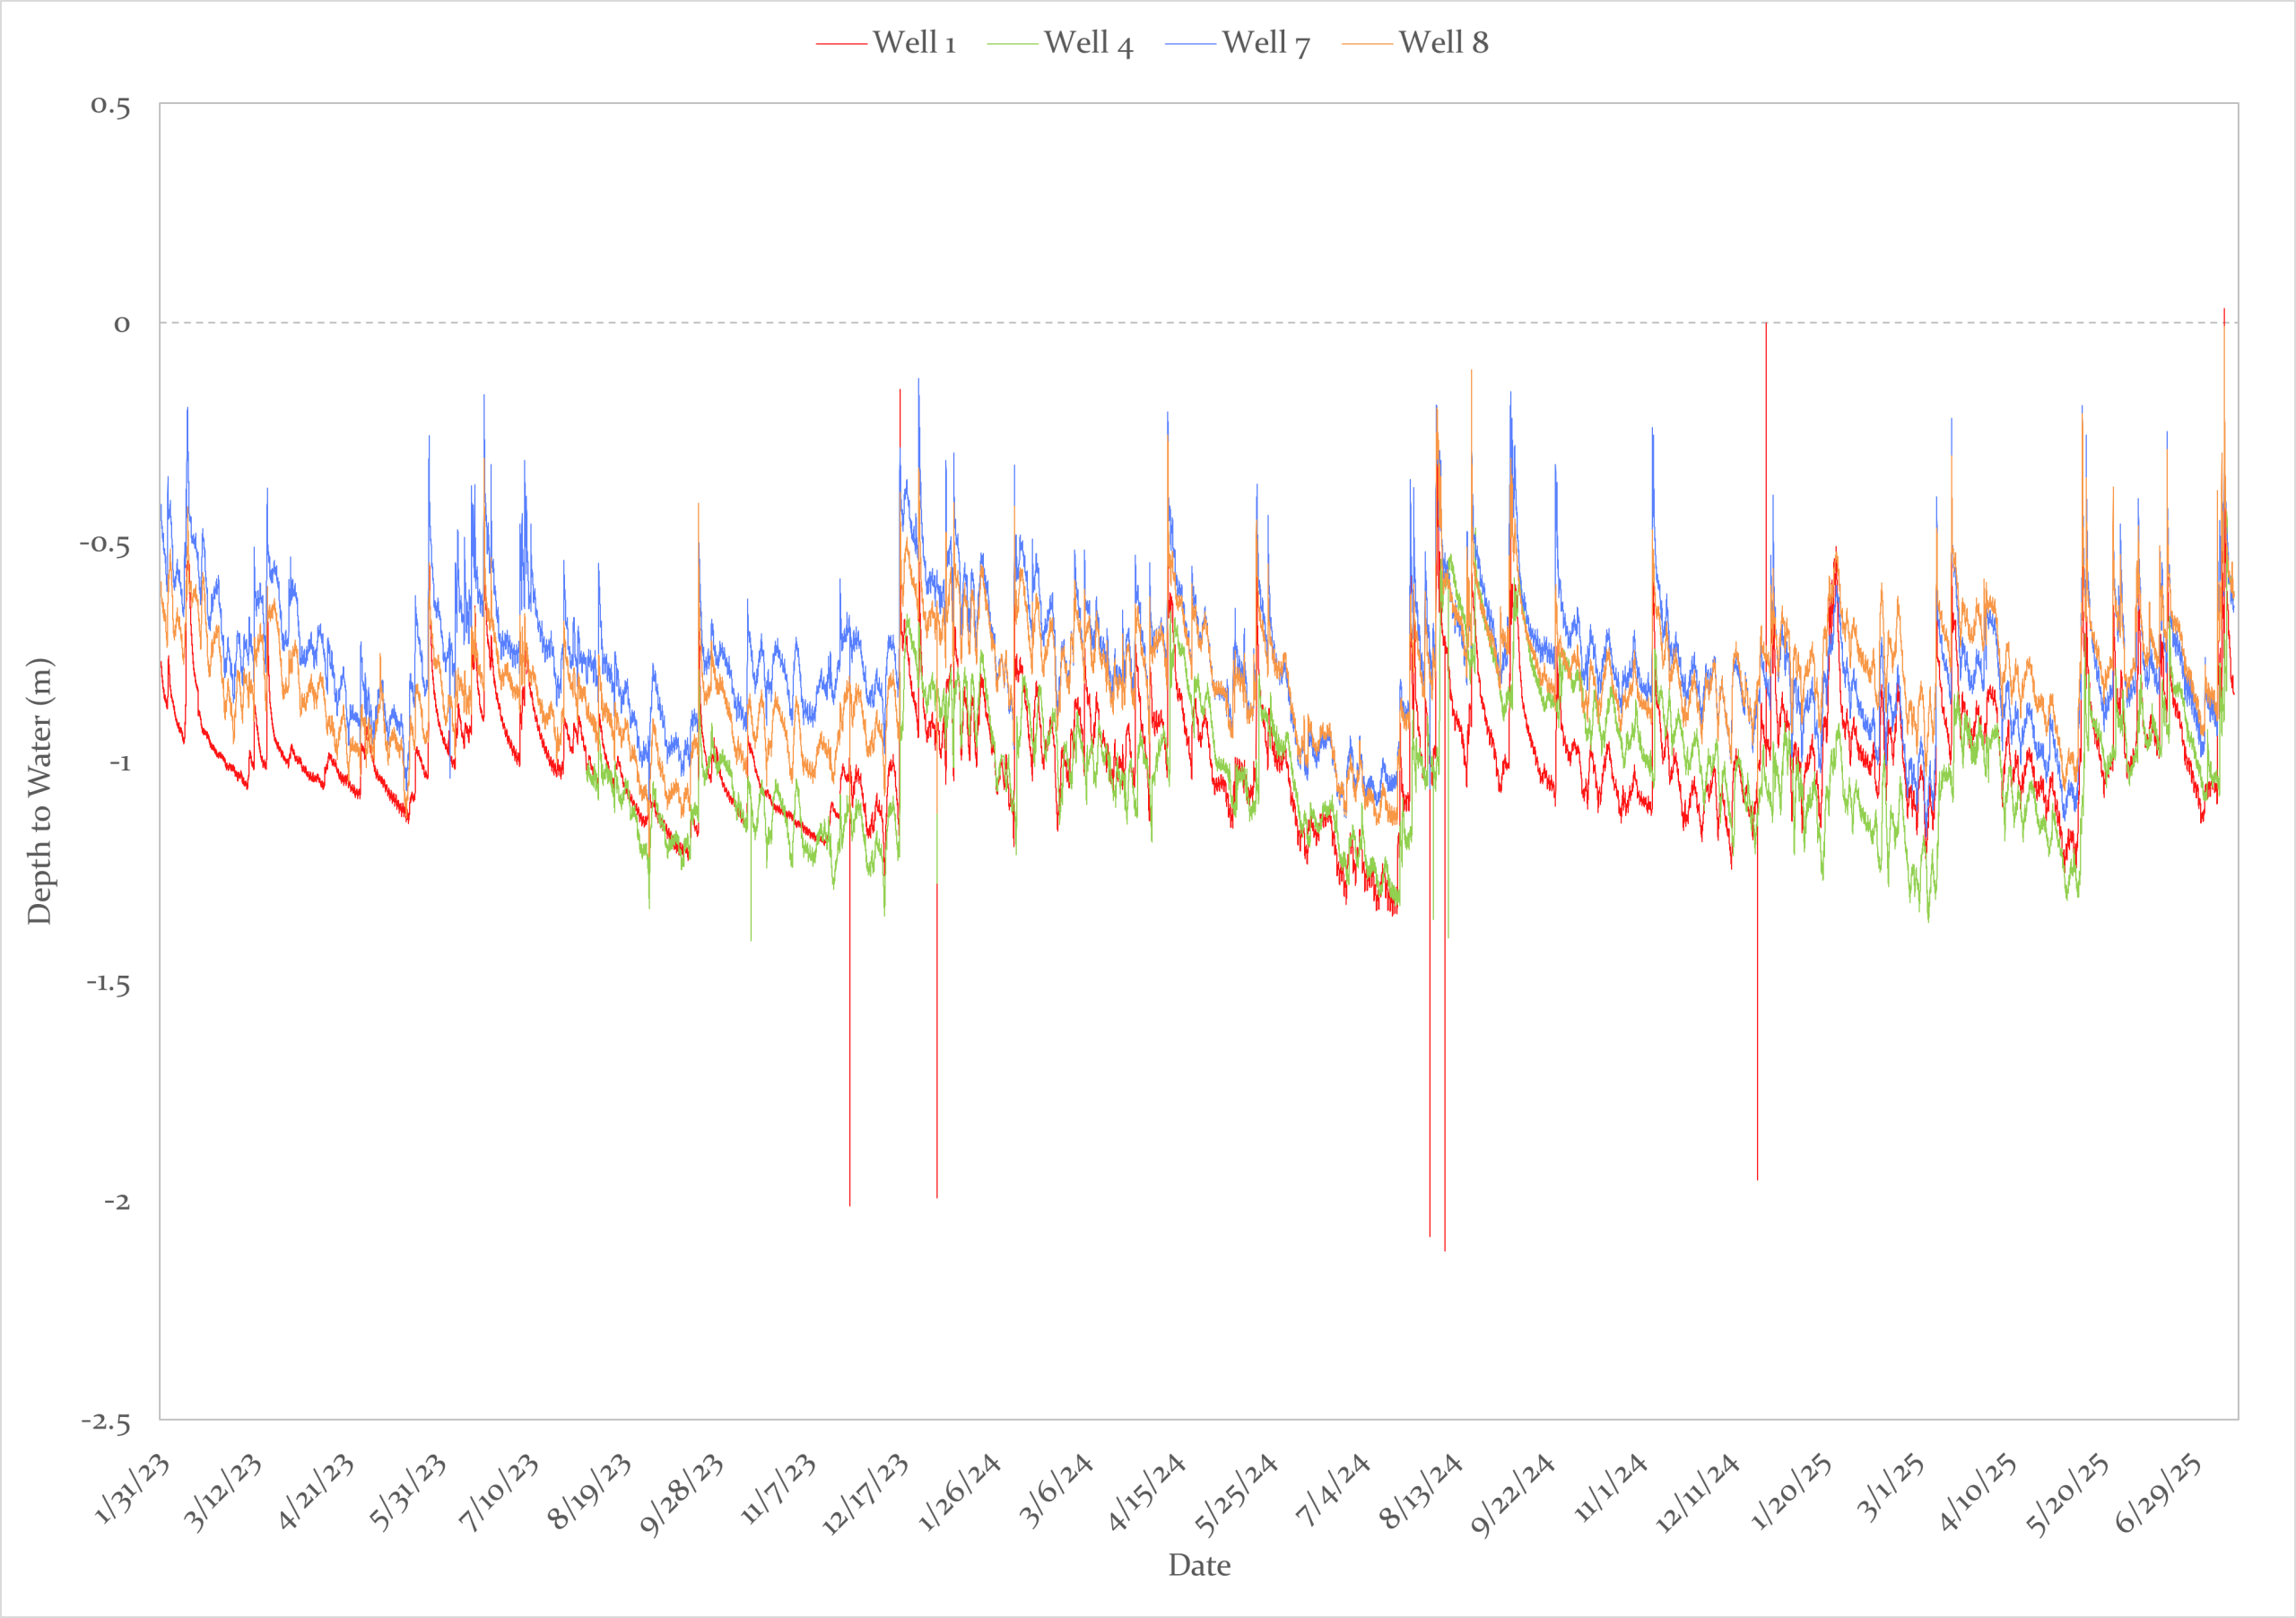
Hourly
Groundwater Data
Our groundwater dataset consists of hourly water level measurements collected from four monitoring wells. The values are reported relative to the ground surface, with negative values representing water levels below the terrain and positive values above terrain. Positive values do not necessarily indicate surface flooding, this is because the wells are PVC pipes, so the measured water level must travel down and around the pipe before being recorded, meaning the system captures subsurface conditions rather than direct surface inundation. This dataset allows us to track short- and long-term groundwater fluctuations in response to tidal influence, precipitation events, and other hydrologic drivers. For more information on groundwater data points please follow the link below:
Learn More About
Groundwater Monitoring

Well 1
Well 1 is equipped with the Aqua TROLL 200 Data Logger, which records pressure (which allows us to derive water levels), temperature, and conductivity. Its slim design and corrosion-resistant materials make it well-suited for long-term monitoring in coastal environments like ours. Data can be viewed in real time through mobile apps or connected systems, helping us quickly understand changing groundwater conditions.

Wells 4, 7, and 8
Wells 4, 7, and 8 use the Rugged TROLL 200 Data Logger. These loggers are designed for dependable, low-maintenance groundwater monitoring. They track pressure differentials with high accuracy, and the data can be accessed directly on site or remotely. Built with durable materials, they can store large amounts of information and operate for years without frequent servicing.

Daily
Precipitation Data
Precipitation is measured daily using the ATMOS® 41 Gen 2 All-In-One Weather Station, a compact, research-grade sensor designed for continuous operation in coastal and harsh environmental conditions. The system integrates 12 environmental sensors, including air temperature, relative humidity, wind speed and direction, solar radiation, barometric pressure, lightning strikes, and dual-mode precipitation measurement. Its tipping-cup rain gauge provides a high-resolution (0.017 mm) count of precipitation events, while gold-plated sensors and a sonic anemometer ensure consistent, low-maintenance performance. Data are transmitted to a ZL6 logger for cloud-based storage and integration with additional sensors, offering a robust and accurate record of precipitation dynamics at the site. The precipitation data will be updated monthly, for more information on rainfall data points please follow the link below:

Average Daily
Tidal Data
Tidal water levels are sourced from NOAA Tides and Currents using the Fort Pulaski tidal gauge, which provides hourly water level observations. To simplify interpretation, we manually calculate daily averages, allowing comparison of higher-than-normal and lower-than-normal tide days. This approach smooths short-term fluctuations and highlights broader tidal patterns that may interact with precipitation and groundwater processes. By combining these daily averages with site-level groundwater and precipitation data, we gain a more complete picture of hydrologic variability and coastal water interactions. Follow the link below for more information on tidal data: